Retroactive predictability of 2023’s Black Swan: SVB’s risk mismatch in 10 graphs
Uncover the risk spiral within SVB’s balance sheet, specifically concentration risk in the liability book & duration risk in the asset book, which ultimately was a recipe for disaster
The meltdown of Silicon Valley Bank (SVB) shook the startup ecosystem to its core. During this crisis that was catastrophized as a potential startup extinction event, there was collective anxiety, emotional reactivity, and even full-blown HYSTERIA on social media. Amidst the uncertainty and despair, startup leaders worked relentlessly to navigate this unprecedented chaos and position their companies for survival. I personally witnessed incredible fortitude, personal sacrifice, and teamwork from founders, employees, vendors, investors (+ many others in the community) during a defining weekend that I will remember for the rest of my career.
SVB’s implosion has been characterized as a Black Swan since it displayed a trifecta of attributes: an outlier event that carried extreme impact and is now (after the fact) being rationalized with retrospective predictability. SVB’s failure has been well-covered by the press and social media (Dave Kellogg from Balderton Capital compiled a solid reading list here). Many prominent VCs have spoken up publicly (some more articulate than others). With slight reprieve to take a breath following the frenzy of the past week, I wanted to quickly share ten charts which reveal the build-up of risk within SVB’s balance sheet that ultimately accelerated the bank’s demise.
Liability book: Concentration risk in customer profiles
Chart 1 paints a picture of how SVB’s customer base (both in terms of depositors and off balance sheet client funds) was highly concentrated on tech industry startups, companies, and firms. The bank publicly stated that “nearly half of 2022 US venture-backed technology and life science companies” were customers. Beyond industry concentration, SVB had a relatively small customer base of 37,466 deposit customers, but these accounted for over $170Bn in deposits at the end of 2022.

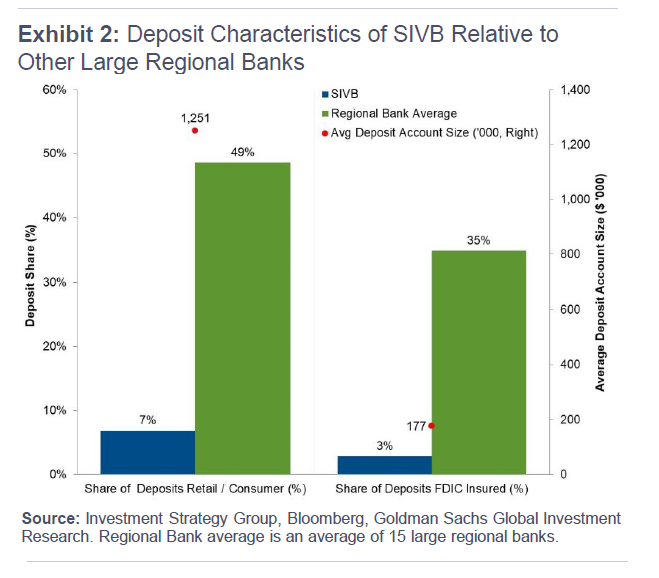
Chart 1 — Source: Silicon Valley Bank, “Q4 2022 Financial Highlights” (1/19/23) The Federal Deposit Insurance Corporation (FDIC) insures deposits up to a $250k limit. As highlighted, since SVB catered primarily to tech corporations, many of these deposits were large and over the insurance guarantee. Chart 2 below visualizes how on a blended basis, the broader industry has a more diversified customer base compared to SVB, with the average account size at other large regional banks falling within the existing FDIC insurance threshold:
Chart 3 below illustrates the same perspective as Chart 2 but from a different angle, showing how SVB had a higher risk deposit base compared to other banks. Related to this exhibit, it is worth noting that SBNY (Signature Bank), which as of Q4 2022 had a higher share of uninsured customer deposits compared to SVB, was closed by regulators over the weekend.

Chart 3 — Source: JP Morgan Asset Management, “Silicon Valley Bank failure” (3/10/23) As the tech industry experienced a boom during the past several years with record-high levels of venture fundraising activity in the 2020-2021 period, SVB’s deposits skyrocketed and outpaced its peers as shown in Chart 4. According to Goldman Sachs, SVB’s deposits nearly tripled since the end of 2019 while the wider industry’s deposits grew a more modest 34% over the same period.

Chart 4 — Source: JP Morgan Asset Management, “Silicon Valley Bank failure” (3/10/23) However, this continued growth was not sustainable as investment activity slowed in 2022 and the idiosyncratic risk of SVB’s concentrated customer base came to bear. Compounding this, as Chart 5 illustrates, while SVB had expected a slowdown in client fund inflows, it had to lower its 2023 outlook as it did not anticipate that cash burn (i.e. outflows) at these companies would remain elevated despite the slower fundraising environment. SVB’s deposit base fell from $198Bn at the end of 1Q22 to $169Bn by the end of Feb’23, representing a staggering ~$30Bn of deposit shrinkage within a short period of time.

Chart 5 — Source: Silicon Valley Bank, “Q1’23 Mid-Quarter Update” (3/8/23)
Asset book: Duration/interest rate risk
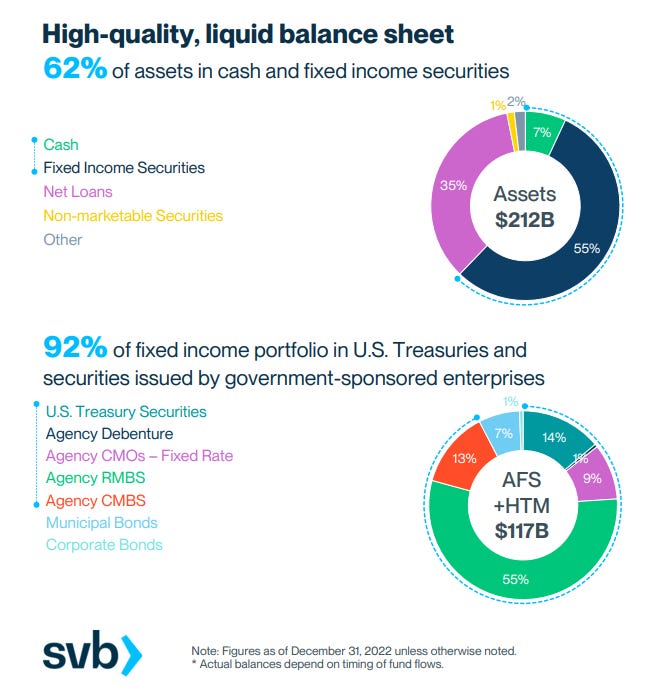
During the period when SVB’s deposits were surging (discussed in Chart 4), instead of keeping the majority in cash or channeling these toward loans, SVB deployed the majority in securities (Chart 6). Notably, SVB invested in fixed-income securities that were ostensibly safe, including government bonds, residential mortgage-backed securities, and commercial mortgage-backed securities. So the credit risk issues that plagued previous bank failures (such as the Great Financial Crisis) were not necessarily a concern for SVB since it was investing in high-quality securities. All’s well that ends well? Not quite.

Chart 6 — Source: Silicon Valley Bank, “Q4 2022 Financial Highlights” (1/19/23) As Chart 7 below illustrates, compared to the average bank, SVB had a much higher share of securities (and lower share of cash and loans) relative to deposits. Keep in mind too that SVB’s deposits were mostly at-call or short-term in nature, while SVB’s securities portfolio was majority long-dated, fixed-rate, and locked in at historically low yields. Bloomberg reported yesterday that SVB’s asset-liability committee received an internal recommendation in 2020 to buy shorter-term bonds, but this was rejected since it came at the cost of earnings reduction.
This underpinned the biggest risk issue for SVB’s asset book: SVB was materially exposed to duration risk and vulnerable to mark-to-market losses in a rising interest rate environment (bond prices move inversely to yields). As interest rates hiked, the unrealized losses on SVB’s entire securities portfolio (assuming immediate realization, such as in cases when SVB would need liquidity urgently) could essentially wipe out its entire tangible book equity (Chart 8). It is not uncommon for banks to borrow short (in the form of deposits) in order to lend or invest long, which could leave them exposed to short term shocks even if the long term portfolio is solid. But as Chart 8 shows, other banks had significantly less extreme exposure:

Chart 8 — Source: JP Morgan Asset Management, “Silicon Valley Bank failure” (3/10/23) It wasn’t just the magnitude of total potential losses from SVB’s securities holdings that was concerning, there was also a significant accounting recognition issue adding complexity to SVB’s situation. Marc Rubinstein of Net Interest wrote an excellent piece about this topic. When investing in securities, banks designate upfront if assets are “available-for-sale” (AFS) or “hold-to-maturity” (HTM). AFS assets are marked-to-market but HTM assets are not revalued daily. This is not an issue if HTM assets are held until their maturity, but selling HTM assets before maturity poses complications since it results in larger parts of the portfolio being suddenly marked-to-market (in SVB’s case it would be recognizing massive losses quickly), which can in turn then result in the need for a capital raise. This nuance became consequential in SVB’s case since SVB relied extensively on HTM designation in its portfolio for long-dated securities (Chart 9):
Despite the high sensitivity to interest rate movements, SVB took limited hedging measures which were inadequate given the size of the portfolio. Notably, SVB did not have a Chief Risk Officer for much of 2022. As Chart 10 indicates, the duration of portfolio pre and post hedge-adjustment was unchanged.

Chart 10 — Source: Silicon Valley Bank, “Q4 2022 Financial Highlights” (1/19/23)
At the end of 2022, SVB looked “healthy” on the surface as it had approximately $209.0Bn in total assets and about $175.4Bn in total deposits. But perception is not always reality, and the liability-asset risk mismatch was already looming in the balance sheet. All of these risks are theoretical until a very real catalyst, such as $42Bn (~25% of deposits) in withdrawals, ignites the fire.
Regardless of how you choose to interpret the data and rationalize the narrative behind SVB’s collapse, it is undeniable that the cascading asymmetric risk transfer resulted in founders going through unnecessary suffering and innocent employees becoming collateral damage. This ordeal is likely to cast a long, heavy shadow on the industry with more second-order effects to come, and should warrant deep introspection from the entire industry. May this be the only Black Swan of 2023.


