The reckoning of “pandemic tech darlings”: Lessons on growth function shocks
Many investors rewarded "pandemic winners", assuming a new growth baseline had been set. But Covid's impact was not one-dimensional, & 3 nuanced growth archetypes emerged after the system shock.
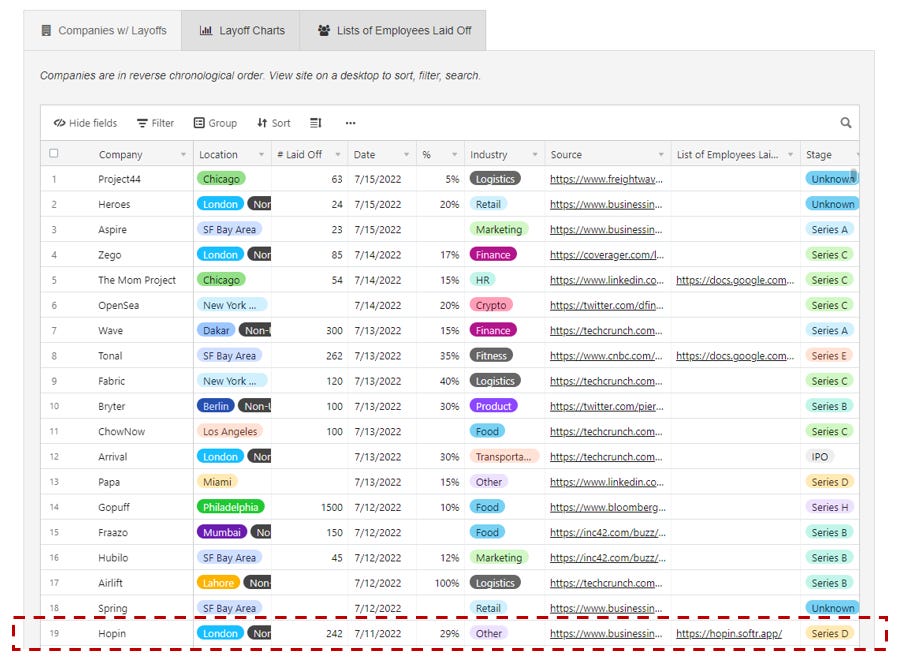
Last week, virtual events platform Hopin announced a second round of layoffs this year, slashing another ~30% of employees. This news hit hard on a personal level as several friends were affected. In a flurry of frequent tech layoff announcements (see tracker below), this may seem unremarkable. But considering Hopin (founded in 2019) was an investor “darling” during the pandemic – hitting the unicorn milestone at breakneck speed by the end of 2020 and reaching a valuation of $7.75Bn in its last round of funding – this development made waves throughout the startup ecosystem.
Source: https://layoffs.fyi/ (accessed on 7/15/22)
In the wake of this news, I reflect upon:
What was the basis for assigning high multiples to “pandemic tech darlings”?
Where were the investor blind spots?
How was the growth function disrupted by Covid?
1. What was the basis for assigning high multiples to “pandemic tech darlings”?
Fueled by remote work tailwinds, Hopin became one of the fastest growing startups in history, reaching $100MM in ARR within 2 years of its founding. Consequently, investors rewarded this feat by awarding the company with a staggering 75x revenue multiple.
ARR growth rate, amongst other key fundamental metrics, is widely considered to be a North Star signal that private investors use to determine market leadership. Hopin’s growth was remarkable to say the least, blowing away historical benchmarks:
Source: https://www.bvp.com/atlas/scaling-to-100-million#ARR-Growth-Rate
Hopin’s story is not one-off. In the public markets, “pandemic darlings” such as Zoom, Peloton, Carvana, and Netflix, all saw similar trajectories of astronomical realized growth during the pandemic. They were consequently rewarded by investors with record-high stock prices reflecting a consensus view that this accelerated growth was permanent, and that a new baseline had been established.
But we all know how the story ends. As many of the pandemic tailwinds turned out to be fleeting, several of these companies saw drastic corrections in their stock prices as they failed to live up to growth expectations. To illustrate this point, I assembled a custom index of “pandemic darling” stocks to benchmark performance against the BVP Cloud Index as well as the S&P 500:
2. Where were the investor blind spots?
Hindsight is 20/20 and it seems obvious now that investors should have anticipated that this growth was unsustainable in a post-pandemic world. But thinking back to mid-2020 (when I first began my career as a VC), it was not imminently clear how long lockdowns would last and that we would be where we are today.
Furthermore, several of the “pandemic tech darling” investors are extremely savvy and had reasonable basis for their underwriting models. John Luttig of Founders Fund wrote an outstanding piece about the temporary nature of Covid tech acceleration, and how miscalculation may not have been apparent at the time since historical precedent showed that tech growth acceleration tends to be durable.
To measure the durability of growth for cloud companies specifically, my team and I at Bessemer developed a “Growth Endurance” framework. Using data from the past decade, we found that high-growth cloud companies were able to retain 70%-80% of their growth from one year to the next, providing more substantiation to Luttig’s observations:
Source: https://www.bvp.com/atlas/state-of-the-cloud-2021#The-Good-Better-Best-Framework-Growth-Endurance
3. How was the growth function disrupted by Covid?
So why was this paradigm different? The pandemic was an unprecedented shock to the system that could not be captured by previous models. I note three archetypes of Covid growth function shocks:
I. Temporary exponential growth from illusion of market opportunity
The pandemic forced behavior change, resulting in new customers adopting temporary substitutes to in-person actions that they would not have necessarily embraced in regular times. For certain companies, this led to the upward limit (i.e. total adoption potential) of S Curve parameters being pushed up temporarily due to the creation of an “artificial” addressable market opportunity from acquisition of these transient customers.
Tech-enabled online used-car dealer Carvana could be an example of this archetype. The typical used-car buying experience has often been an in-person process involving physical dealerships or vehicle showrooms as this tends to be a “try before you buy” purchase. However, as lockdowns prevented in-person interactions, customers began to embrace e-commerce channels for vehicle purchases. Leveraging these tailwinds, Carvana saw tremendous growth in units sold and even hit profitability earlier than expected during this period, causing investors to hold high hopes for Carvana’s potential. However, as the economy re-opened, Carvana reported its first-ever decline in quarterly sales as purchasing behaviors began reverting to in-person norms
This is a common archetype that might include other examples such as Peloton and Hopin. While companies in this bucket certainly seemed to show product-market fit, the issue was that the “market” variable of the equation was an illusion, eventually leading not just to slowed growth, but also churn due to revision toward the original equilibrium. Investors had essentially overestimated market potential based on temporary conditions.
II. Unsustainable exponential growth due to acceleration within original market opportunity
Some might perceive Zoom’s growth to be part of archetype I. The company’s trendline of “customers with more than 10 employees” would corroborate this hypothesis as Zoom saw notable gross logo churn following re-openings, indicating that these accounts may have been “artificial” acquisitions not part of Zoom’s true market opportunity. An example of this may be high schools or gyms using Zoom to conduct online classes during the pandemic but have not carried out the same practice after locations re-opened.
However, Zoom very recently (and astutely) started reporting on a new metric of “enterprise accounts” as the company believes this segment to be its most important market opportunity moving forward. The trend in the new data offers a slightly more nuanced view around Covid’s impact on steepening the company’s S Curve slope (rather than limits) within its core enterprise TAM.
In this interpretation, Zoom was able to acquire logos within its addressable enterprise customer set very quickly as companies were forced to employ web conferencing systems almost overnight to adapt to a work-from-home world. In normal times, these companies may have had plans to eventually roll-out web conferencing solutions, but Covid forced them to bring forward these digital transformation efforts. Indeed, as Satya Nadella stated at the start of the pandemic, “we’ve seen two years’ worth of digital transformation in two months”.
With Covid fueling accelerated penetration within Zoom’s core enterprise TAM, Zoom was able to achieve a growth surge for some time. But ultimately, growth slowed down in accordance with the inflection point of the S curve. Indeed, as the new reported metric shows, Zoom is still adding incremental enterprise customers today, just at a slower rate. Following re-openings, the net dollar retention of Zoom’s enterprise customers currently remains strong at 123%, signaling that there is product-market fit within these accounts. Other anecdotes of this growth archetype that I’ve come across in the private markets include the acceleration of commerce infrastructure adoption amongst B2B as well as B2C enterprises.
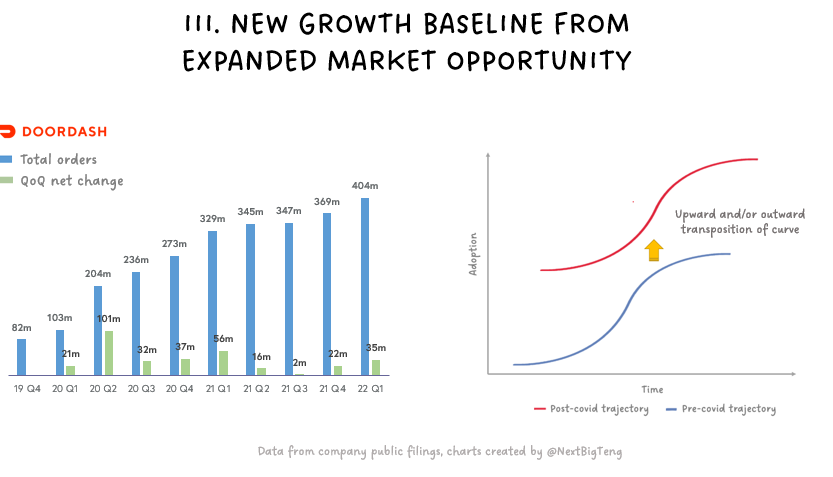
III. New growth baseline due to expanded market opportunity
As Luttig mentioned in his post, a lot of investor exuberance stemmed from the belief that Covid had established a “new normal” for tech demand, and that old growth rates and endurance would continue from this higher step-function baseline. Said another way, Covid would catalyze new, permanent demand amongst users who were not previously addressable, thereby expanding the proverbial pie.
In retrospect, while this step-up in baseline did not apply to all of the “pandemic darlings”, there were certainly a few true “winners” that demonstrated growth of this nature. Last month, Bloomberg did a deep dive on the food delivery market. Their research showed how the entire industry saw a step-function change in demand during the pandemic, and has managed to sustain this new baseline:
Source: https://secondmeasure.com/datapoints/food-delivery-services-grubhub-uber-eats-doordash-postmates/
DoorDash was one of the biggest beneficiaries and has managed to consolidate and build upon pandemic gains even following re-openings:
Another example involves cloud adoption. From family-owned shops to essential services to large corporations, Covid compelled many businesses to shift either from pen and paper practices or on-prem software, into the cloud. Gartner found that the proportion of IT spending that shifted to cloud had a step-function increase after the COVID-19 crisis. This is continuing to compound, with cloud projected to exceed 45% of global enterprise IT spending by 2026, up from 9.1% in 2020. In particular, IaaS is the fastest growing segment and Gartner significantly revised spend projections upward from pre-covid forecasts:
While growth may all look indistinguishable on the topline, the aftermath of post-Covid market correction for “pandemic darlings” reinforces the importance of diving past the surface and factoring growth function nuances into probability analyses, especially when faced with unprecedented events.
An important parting note: Lots of incredibly talented individuals were impacted by recent tech layoffs and are currently looking for new opportunities. Please check out the contact info databases listed on https://layoffs.fyi/ to help.
Questions? Thoughts? Feel free to leave a comment or reach out to me on twitter @NextBigTeng!


You may like this essay: https://longform.asmartbear.com/docs/exponential-growth/
I guess the core of the problem is thinking that growth rates have significant auto-correlation. The reality is that the more you grow, the harder it is to grow, for obvious reasons. I think that many of used heuristics like BVP's growth endurance to model that maybe have given problems to investors.
The core problem notheless is that if you run some DCFs to many SaaS Cos (not those consumerCos), a 50% decline is an easy output to a 3% increase in discount rates (a mix in RFR and ERP). So I guess for many of these SaaSCos, time will tell that the market was roughly right about the growth trajectory, but the duration made the path very bumpy. DDOG 45% drawdown since Nov 1st isn't weird in the context of higher discount rates, in fact, it's just about what a conceptual model would predict.
Important to be aware that in many cases in SaaS there wasn't big misforecasts. This go the other way, a stock down 50% can have near to no bad news priced in, so also it's important to be aware.
Keep up with the good work!