Rule of 40 valuation premium: The relative impact of each efficiency score component
Cloud valuations are now more correlated to efficiency score (ARR growth + FCF margin) than growth, but which component is more impactful and how has this changed from market peak till today?
Following the market reset in early 2022, capital efficiency is en vogue again! In both private and public cloud markets, growth at all costs is no longer being rewarded. Rather, the focus is now on efficiency (growth at optimal costs). As I highlighted previously, this is a marked reversal from previous years where software valuations used to be more correlated with growth alone rather than efficiency score (growth + FCF margin):
Source: Morgan Stanley Weekly Software Datapack (08/19/22)
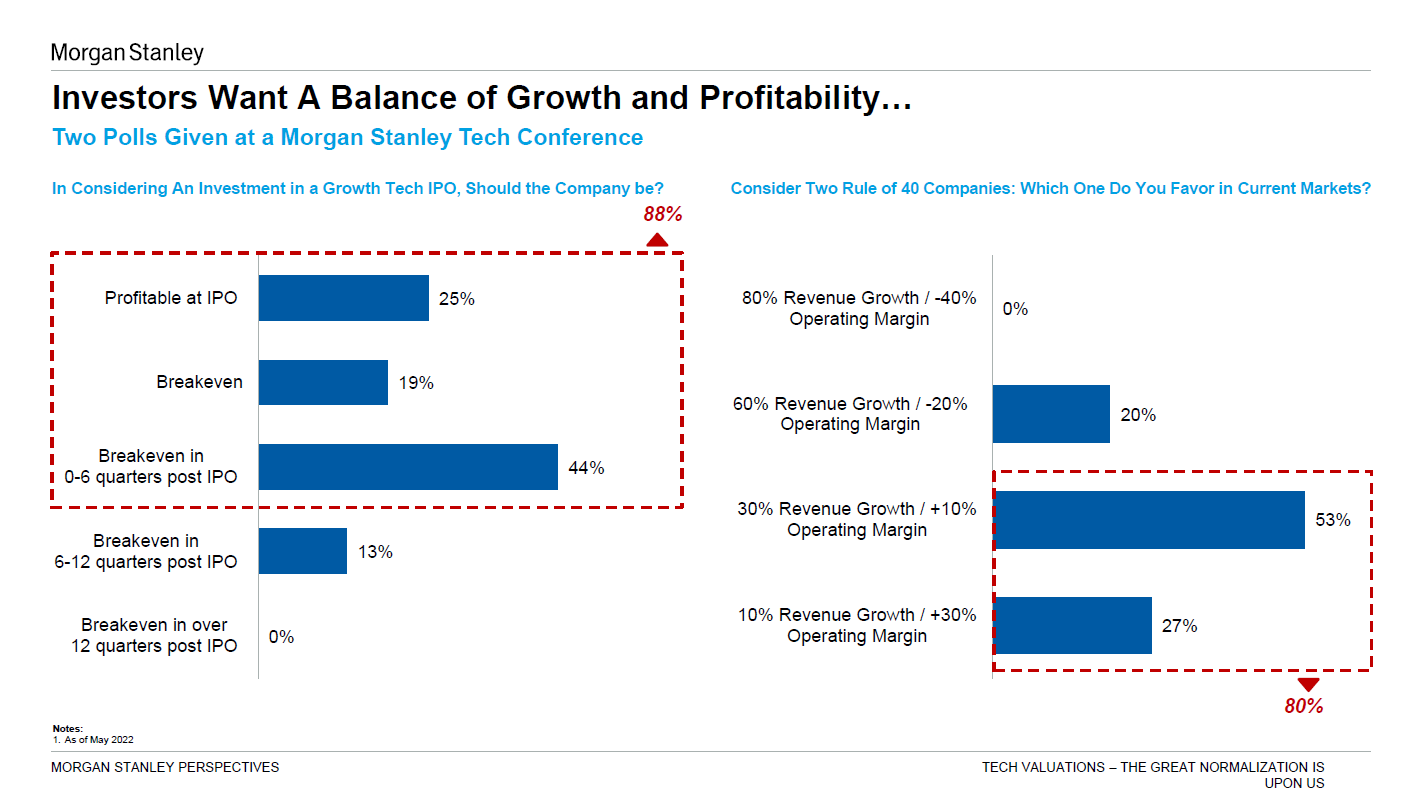
Efficiency score involves a multi-variable equation with two key components — 1) growth rate and 2) profitability measure. Two companies with contrasting profiles can achieve the same absolute efficiency score outcome using different levers along the “Rule of 40” optimal frontier. Recently, I saw some discussion around which “Rule of 40” profile is most favored in current market conditions:
Source: Morgan Stanley Perspectives: Tech Valuations – The Great Normalization is Upon Us (July 2022)
This got me thinking about the valuation premium driven by each component of efficiency score. In this piece, I peel back the layers of efficiency score using BVP Emerging Cloud Index (EMCloud) data to discuss:
Quick refresher on efficiency score components
What is the magnitude of the efficiency score valuation premium?
Why does a component view matter?
What is the relative valuation impact of each efficiency score component?
I. Quick refresher on efficiency score components
Efficiency score attempts to contextualize the relative tradeoff between growth and burn. It is unfair to harshly judge fast-growing companies for being cash consumptive rather than cash generative as they are often making foundational, long-term investments to scale. However, it is important for investors to observe whether growth in topline revenue effectively reflects dollars funneled in the business. As such, investors tend to define efficiency using a growth component in relation to a profitability component.
As a reminder, my team and I at Bessemer define efficiency score as:
Net new ARR over net burn for startups under $30MM ARR, with the best-in-class benchmark being >1.5
ARR growth plus FCF margin for companies over $30MM ARR, with “Rule of 40” as the target benchmark
The ARR growth component of efficiency score is expected to decrease over time as it is easier to grow at a higher rate on a smaller quantum of revenue initially, and the marginal dollar is always harder to acquire. Conversely, over time, the FCF margin component is expected to improve as companies move through their growth S curve, driving toward stronger unit economics and obtaining more leverage as they scale. This dynamic is visualized in the charts below:
Source: Scaling to $100MM Report from my colleague Mary D’Onofrio
II. What is the magnitude of efficiency score valuation premium?
With the market pullback and volatile macro conditions, it has been no surprise that starting in Q1 of this year, valuation lenses have shifted toward rewarding efficient growth rather than growth alone. It is now well understood that valuations for cloud companies are currently more tightly coupled with efficiency scores rather than absolute growth rates:
How significant is the efficiency premium on valuation? The chart below says it all, with “Rule of 40 or higher” EMCloud companies trading on average 150% higher than their less efficient peers:
Bonus fact: all of the cybersecurity security companies in the BVP Cloud Index outperform the “Rule of 40”. Cyber is the category with the highest average efficiency score (64.2% vs. the Index average of 39.1%) and is consequently the category that commands the highest average forward revenue multiple (11.4x vs. the Index average of 6.8x).


III. Why does a component view matter?
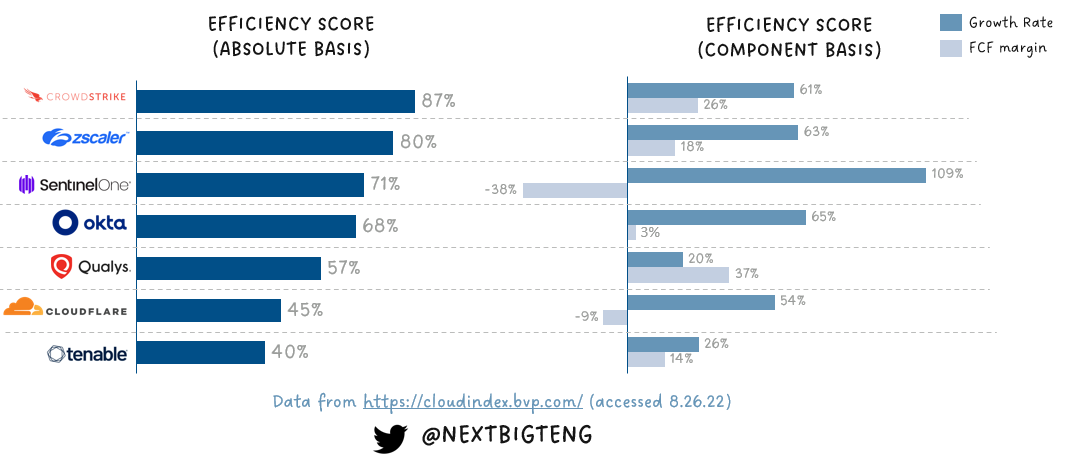
As highlighted in Section I, there are two components that a company balances to get to the “Rule of 40” optimal frontier. This can result in companies with significantly different component profiles having similar absolute efficiency scores. To illustrate this point, I use a few examples from the cybersecurity category within the BVP Cloud Index cohort.
As mentioned in Section II, all of these are companies surpassing the “Rule of 40”. From the chart above, on the surface SentinelOne and Okta have efficiency scores in the 68-71% range, but peeling back the layers, SentinelOne looks to be much earlier in its growth S-curve with virtually all of its efficiency score outperformance being driven by the growth component. An analogous story emerges when comparing Cloudflare and Tenable which both have efficiency scores in the 40-45% range, but have vastly different component profiles.
Why does this matter? While valuations for cloud companies are currently more tightly coupled with efficiency scores rather than absolute growth rates — leading to “Rule of 40” outperformers achieving a valuation premium over less efficient peers —unprofitable “Rule of 40” outperformers faced more significant multiple compression in the past year compared to category peers who also beat the “Rule of 40” but were profitable:
IV. What is the relative valuation impact of each efficiency score component?
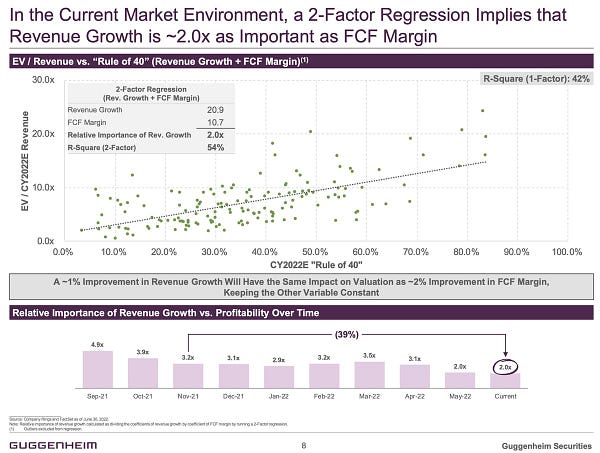
What explains this? Recently, there has been some discussion around which efficiency score variable has greater relative impact on valuation premium. In June, Guggenheim Securities examined the relative importance of revenue growth to profitability margin on valuation for wider software comps. Guggenheim calculated the relative importance ratio by dividing the coefficient of revenue growth by the coefficient of FCF margin in a 2-factor regression. The firm found that a ~1% improvement in revenue growth would have the same impact on valuation as a ~2% improvement in FCF margin, which was a meaningful reversal of sentiment from just a few months prior:


How did this trend look for emerging cloud leaders? Following Guggenheim’s methodology, I conducted a 2-factor regression on EMCloud data from November 2021 (during peak exuberance in the cloud markets) and compared this to where we are today. The findings were astounding.
Similar to Guggenheim’s findings, before the SaaSacre in 1Q22, ARR growth rate for BVP Cloud Index companies was ~6x more important than FCF margin in terms of valuation premium. Said another way, at the height of cloud bull-market ebullience, a ~1% improvement in revenue growth had the same impact on valuation as a ~6% improvement in FCF margin:
Today, the tide has turned drastically. Not only are cloud valuations more tightly coupled to efficiency score, but FCF margin is now MORE impactful than revenue growth rate for emerging cloud leaders, with a ~1% improvement in FCF margin having the same valuation influence as a ~1.1% improvement in revenue growth:
We are entering planning season for 2023, and I hope that this data is timely as growth-stage cloud startups reflect on the optimal balance between growth and burn for the upcoming year. Efficiency, with a focus on profitability, is king/queen in this new paradigm. VCs have belabored the point that growth at all costs is no longer rewarded, but as this analysis shows, the valuation impact from the profitability component of efficiency score is now more significant than ever.


🚀